Images Used in our Experiments
Our EG Syposium on Rendering 2003 Paper
Here is a link to the PDF of our paper, Detail to Attention: Exploiting Visual Tasks for Selective Rendering by Kirstin Cater, Greg Ward, and Alan Chalmers.
Color Plates
We have provided a separate 2-page document containing the color figures from the paper for the viewer’s convenience.
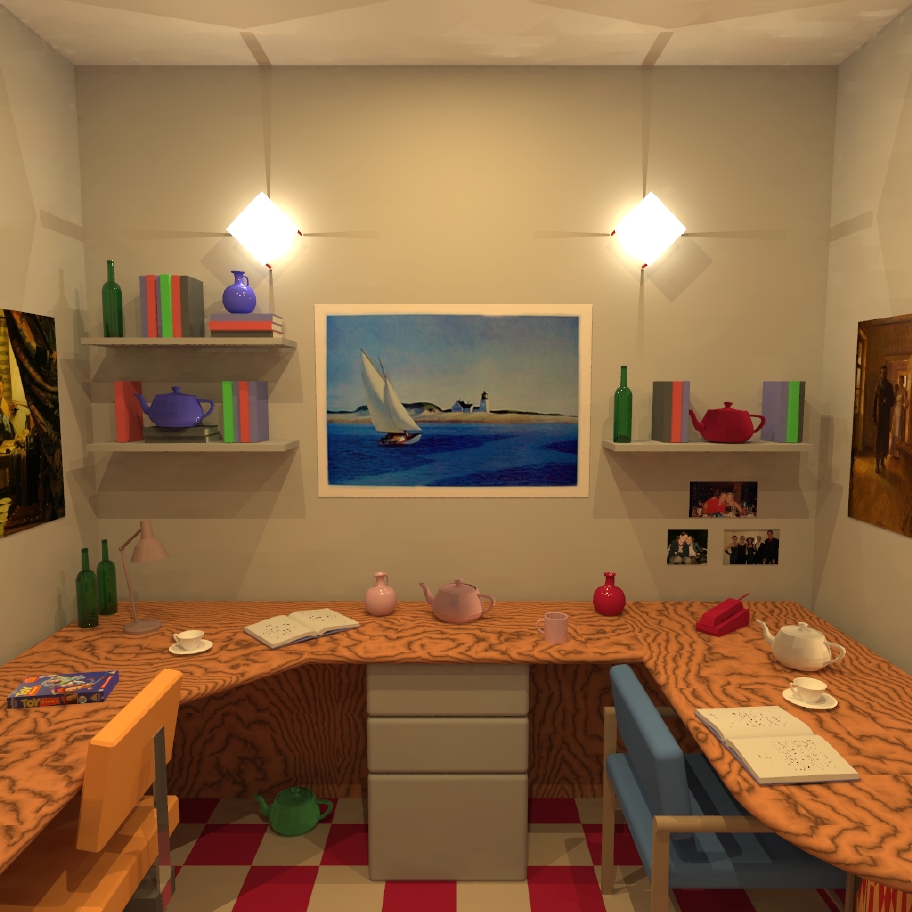
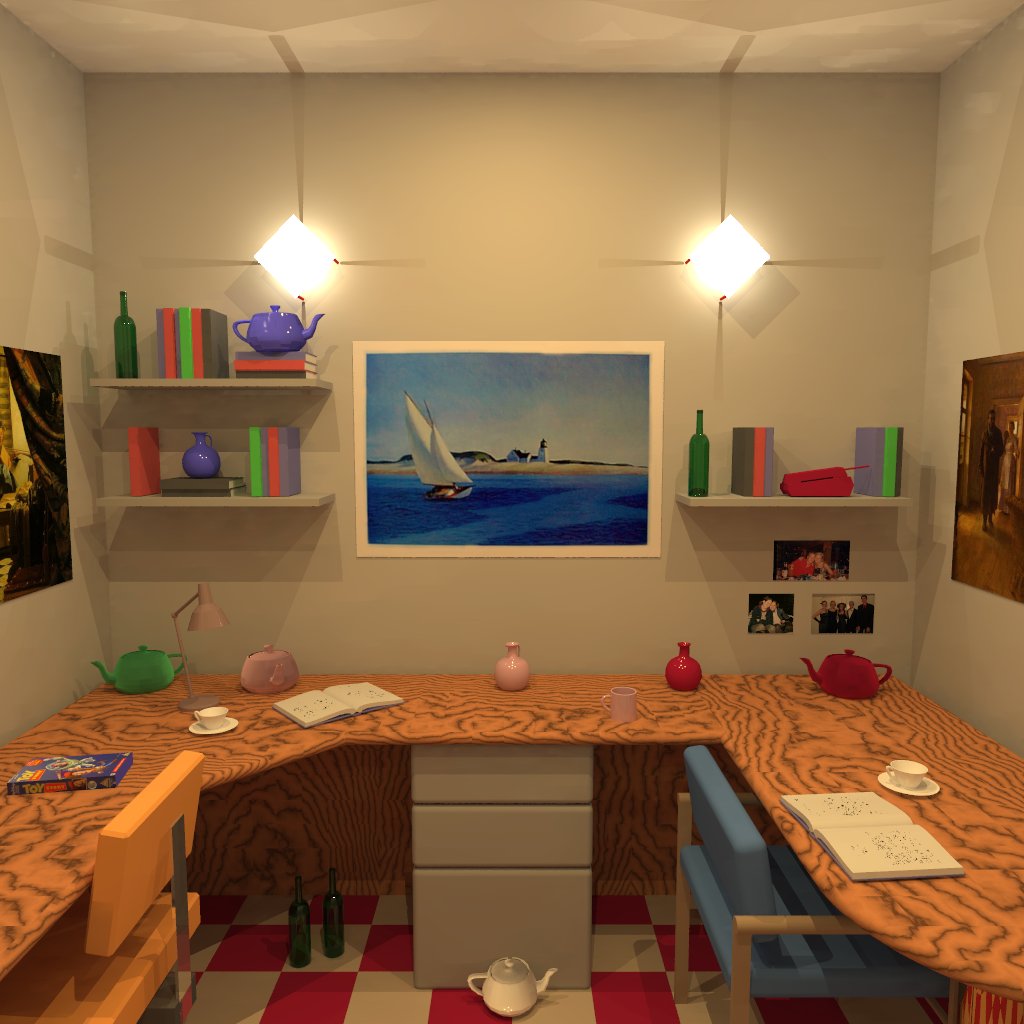
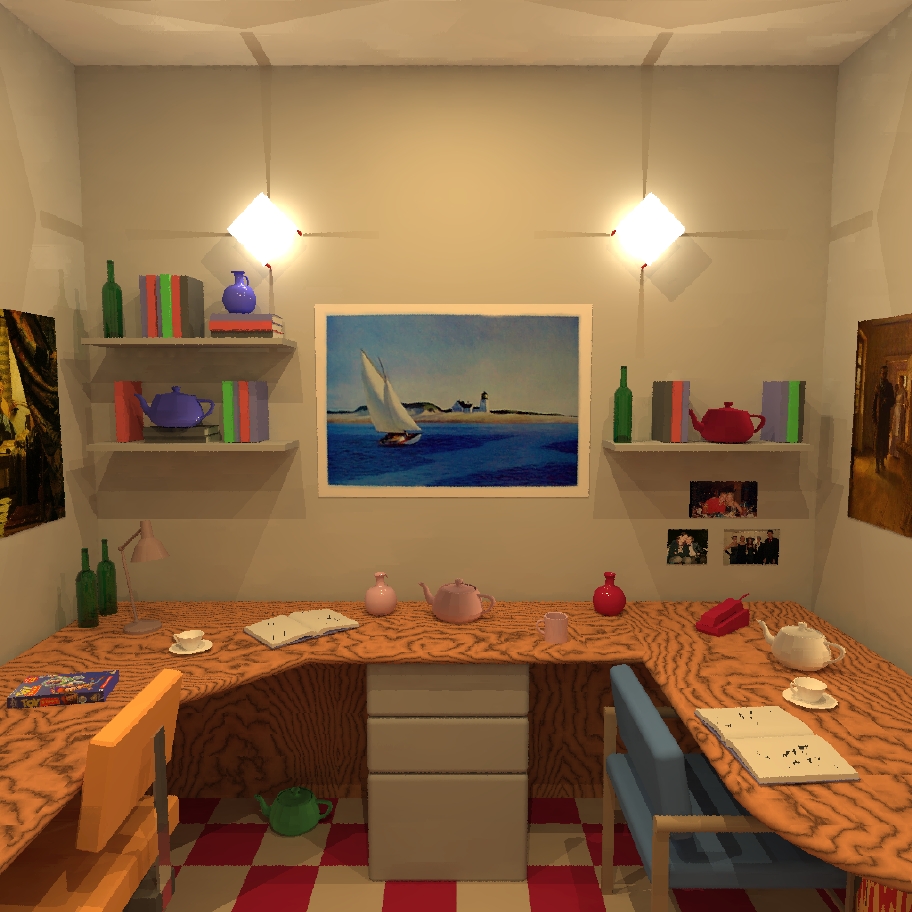
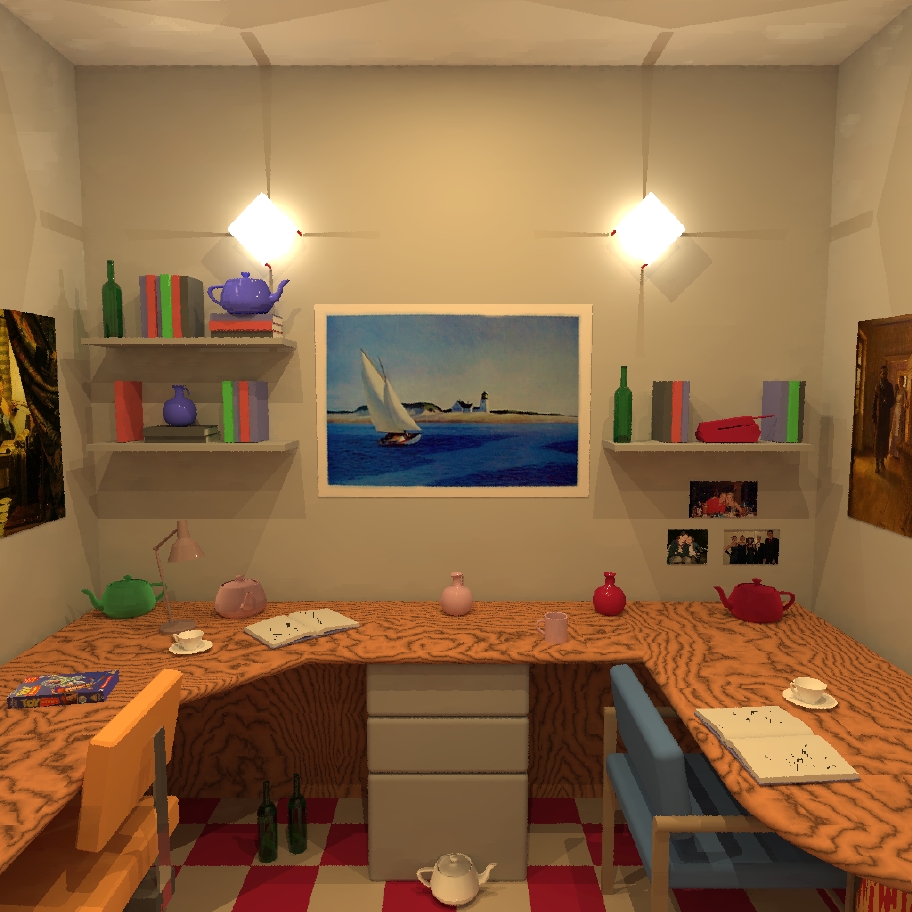
Images Used in our Experiments
The images for the experiment were created using Radiance, and used two models of an office scene the only difference being the location of items in the scene mainly teapots.
See HQSceneA.jpg and HQSceneB.jpg. Both of these images were rendered at a resolution of 3072x3072, which is what we refer to as High Quality (HQ) in the paper.
The other two rendering qualities we used in the experiment were Low Quality (LQ) where the image was rendered at a resolution of 1024x1024 -- see images LQSceneA.jpg and LQSceneB.jpg, and Selective Quality (SQ) -- see images SQSceneA.jpg and SQSceneB.jpg.
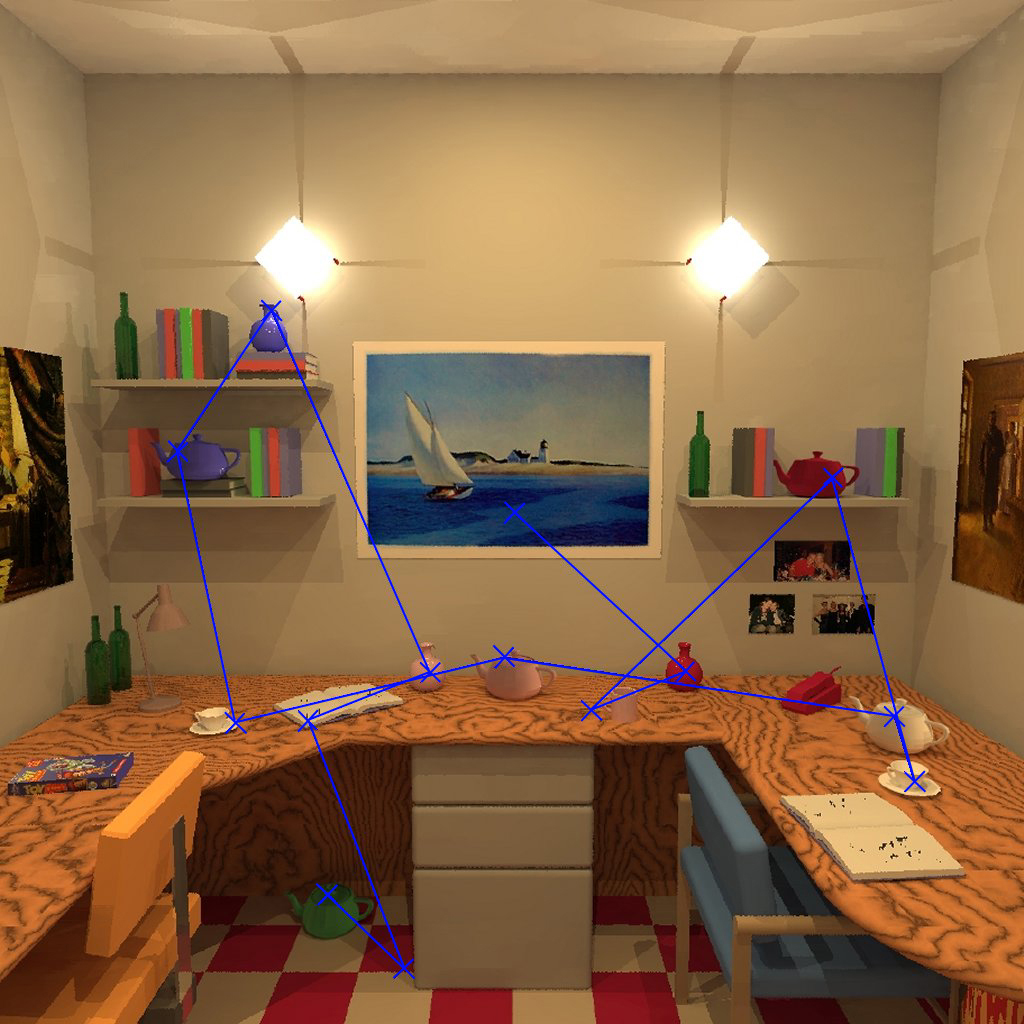
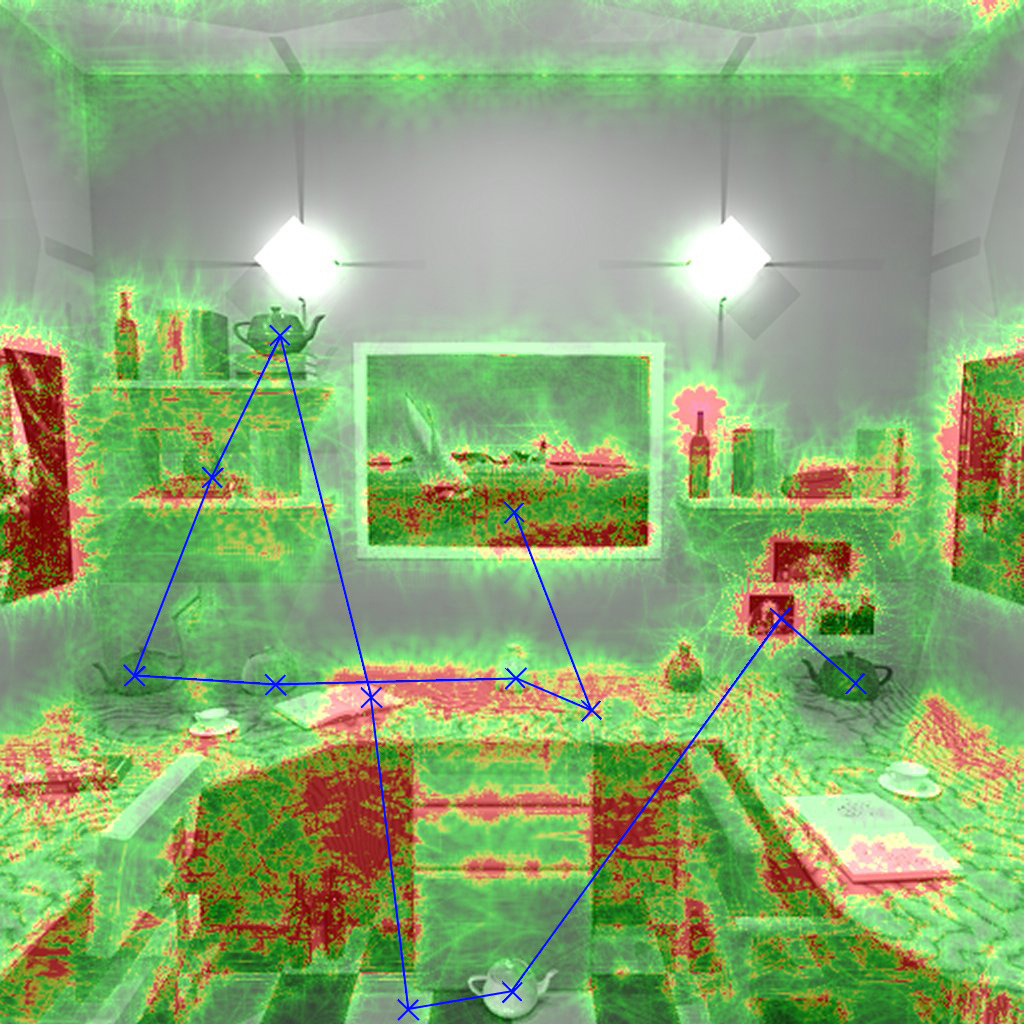
The selective quality images were created by selectively rendering the majority of the scene in low quality (resolution of 1024x1024) apart from the visual angle of the fovea (2 degrees) centred on each teapot. Also included is an example of an eye scan tracked when an observer was counting the teapots, see image EyeTrackTeapot.jpg, and another eye scan superimposed on the VDP image calculated -- see VDPEyeTrack.jpg.
Animation (low resolution copy of video)
Here is the first part of the animation at 320x240 resolution with the highest quality settings, so the artifacts you see should be due to our rendering (as opposed to compression). You may need to copy this file to your hard disk to get an adequate display if your CD-ROM is not particularly fast.
Animation Showing Error, Conspicuity, and Samples
The AVI file seg1bonus.avi shows our animation in the upper left quadrant, with corresponding initial error estimate after IBR refinement in the upper right, the conspicuity map in the lower left, and the number of final samples in the lower right. We offer this as insight to the behavior of our method in operation. On occasion, these maps will flash at places where we had a break in our segment, or had to restart the animation after some problem when it didn’t have the prior frame to work from.